Monday, March 31, 2014

Thursday, March 20, 2014
Compound Interest Formula
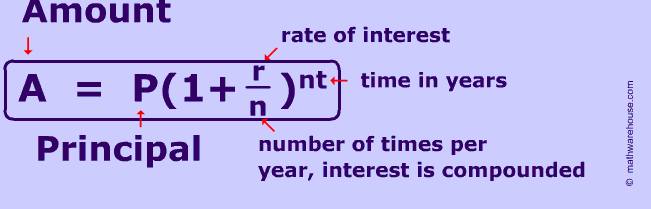
P = principal amount (the initial amount you borrow or deposit)
r = annual rate of interest (as a decimal)
t = number of years the amount is deposited or borrowed for.
n = number of times the interest is compounded per year
Wednesday, March 12, 2014
Graphing Exponential Equations
Graphing Exponential Growth/Decay
1. Create the Parent Graph.
2. Identify A,H,K.
3. Create your new T-Chart.
- Domain: All real #'s.
- Range: y>k; when a is positive. y<k; when a is negative.
- Asymptote: y=k.
4. Draw Asymptote.
5. Graph new points.


- Exponential Formula: y=a×bx-h+k
- a = multiplier.
0<a<1 = compression
a< 0(negative) = flipped over x-axis.
- b = base
0<b<1 = fraction; decay, always decreasing.
B is never negative only the multiplier is.
- h = lf/rt; opposite
- k = up/dn
Monday, March 10, 2014
Tuesday, March 4, 2014
General Forms of a Sequence
A sequence is an ordered list of numbers and the sum of the terms of a sequence is a series
General Form of an Arithmetic Sequence
an = a1 +(n - 1)d
In an arithmetic sequence, each term is equal to the previous term, plus (or minus) a constant. The constant is called the common difference (d).
General Form of an Geometric Sequence
an = a1·rn-1
In a geometric sequence, each term is equal to the previous term, multiplied (or divided by) a constant. The constant is called the common ratio.To find the common ratio, divide the second term by the first termWednesday, January 15, 2014
Characteristics and traits
Range- y-intercepts
End behavior- Describing the two ends of a equation
Absolute Max/min- the one point that is the highest on the graph
Local Max/min- more than one point with a high or low on a graph
Interval of increase- section of a graph where y values are increasing,describing them in terms in x
Interval of decrease- section of a graph where y values are decreasing
X-intercept- point where it crosses the x-axis
Y-intercept- point where it crosses the y-axis
Symmetry- Even symmetry-symmetric about the y-axis
Odd symmetry-symmetric about around origin
Function-Passes vertical line test

One to one- passes vertical line test and horizontal line test
Subscribe to:
Comments (Atom)